HestaPi stuck at 0°-screen (no. 15 of First boot ONE-tutorial)

Dear folks,
i received my double-pack of HestiaPi yesterday from the crowdsupply campaign.I followed the quick-start guide (“First boot ONE · HestiaPi/hestia-touch-openhab Wiki · GitHub”). The HestaPi seems to be stuck at "15. The LCD UI starts with 0 values or blank fields. This is normal until it gets ready. " for 2 hours, the numbers are zero:

I can access the HestaPi via SSH.
I cannot access:
1.) via browser (http://192.168.122.43:8080/start/index or http://192.168.122.43:8080) or
2.) via OpenHAB-App (http://192.168.122.43:8080 entered, but User and password is left empty)

I already tried “sudo reboot”, the result was the same: It is stuck at number 15 of the First boot guide.

The touch screen does not respond.

What can I do to finish the first boot guide?

BTW: I had to make my post shorter, due to these restrictions: “Sorry, new users can only put one image in a post.” and “Sorry, new users can only put 2 links in a post.” Is it really necessary?

I got it running by re-flashing the SD-Card image. This topic can be closed.

Welcome to the club :slight_smile:
Another “easier” method is here. Added a link to the wiki too.

Glad you got it working. Not sure why this happened to a few… Same image is flashed and validated with Etcher with same cards all over the place, still some got this issue on first run only which may have something to do with the expansion of the filesystem that occurs on first boot (and restarts once its done).

Probably not :slight_smile: This comes as default with the forum application and we didn’t customise any settings. You should be ok now to post with less restrictions.

Thank you for your quick answer!

I found out why the touchscreen was not responding: the 3D-printed case looked like someone tried to “correct” something in the area of the frame for the screen. There was a dent in the 3D-print that constantly pressed on the screen. I could solve it by flattening the inner surface of the case.

One big problem persists: The sensor values freeze. I checked the wiring and changed the sensors between the two HestiaPis, but it did not solve the issue.

  1. On one HestiaPi, it works for some hours, then the sensor value gets stuck. After shutting down, removing power and restarting, it works again. When accessing via web, it works: I can set the temperature and the wrong sensor reading is displayed in the web interface. All buttons work fine, also the “shutdown” button.

  2. On the other HestiaPi, the sensor values were shown correctly after a fresh install. Since rebooting, it only displays “0°” and “0%” without the “heating, water and shower”-icons in the top left corner. When accessing via web, I see only a part of the interface:


    After approx. 15 minutes, the “heating, water and shower”-icons in the top left corner appear, but the sensor data is stuck at zero, while the complete webinterface is available:

    The webinterface does respond slowly, but it is running at 100 % CPU-load for more than 30 minutes after booting. When clicking on “Shutdown”, nothing happens. I have to shut it down via SSH.

After investing quite some hours, I did not have a flawless “working out of the box”-experience. To be honest, I am a bit disappointed after buying 2pcs of " HestiaPi Deluxe Kit":

  • One HestiaPi does not work reliably so far due to sensor freezing
  • One HestiaPi does not work reliably so far due to constant sensor reading “0°” and “0%”
  • I had a higher expectation for the quality of the 3D printed cases from the pictures and videos from the crowdsupply campaign (this is a minor issue): 1) my cases were grey instead of white, 2) re-work had to be done to solve the touchscreen-issue, 3) the look is not “good-quality” due to quite some 3D-printing imperfections
  • re-flashing did not solve the sensor freezing issues
  • CPU-load is at 100 % even 30 min after booting

I’ll check the wiring of the “0°”-HestiaPi again tomorrow. I would be thankful, if they will be running reliable soon.

I’m sure we can solve these issues but let’s be clear on the problem as we are confused on which HestiaPi unit has which issue. Let’s call them Hestia A and Hestia B from now on and if possible start a new thread for each to follow easier. Let me respond to your issues below individually:

Does “freeze” mean is stuck in a certain value or does it disappear with blank values?

Do you mean the problem remained with the same board with the new sensor? If yes please check polarity of connecting cable and try this on the sensor pins.

Did you try this solution on this unit?

The “White” case had only been advertised as “Off-white” from the first day and is the one shown on the pictures. Maybe it wasn’t very easy on the screen. There is no White-white option.

I believe these are all fixable. 3D printing has indeed been our biggest issue with the scale the campaign got. We are in the process of moving away from them.

Thank you for your detailed answers! The case problem seems to be solvable the quickest way by re-printing it :wink:

Let’s call them Hestia A and Hestia B from now on and if possible start a new thread for each to follow easier.

I propose to call them HestiaPi 1. and 2., according to the numbers in my previous post.
HestiaPi 1. has the sensor freezing after some time.
HestiaPi 2. has the constant sensor reading “0°” and “0%”. I re-flashed this HestiaPi. The CPU-Load is at 100 % for at least 30 min after booting.

Let’s stick to Hestia 2. in this thread. I’ll start another thread for HestiaPi 1. at another time.

HestiaPi 2. has these symptoms:

  • no uptime is shown
  • the timezone is not remembered:
  • CPU load at 100 % still 30 min after booting (I think this might be the reason why the touchscreen does not respond sometimes)
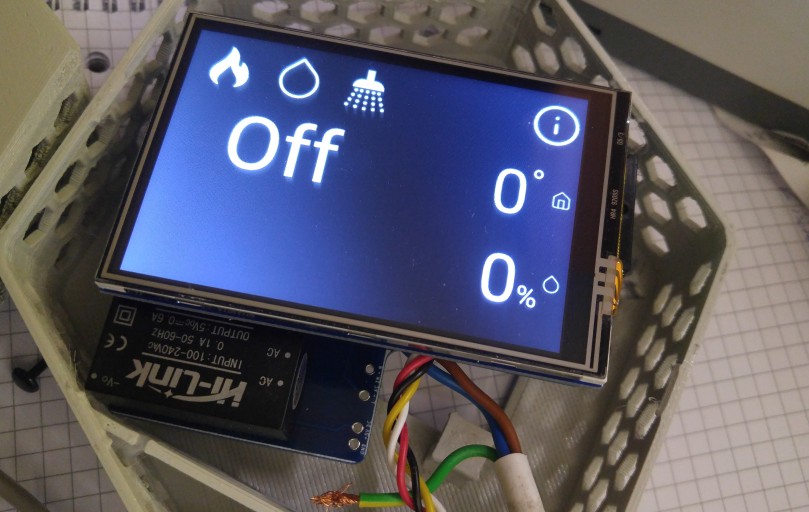
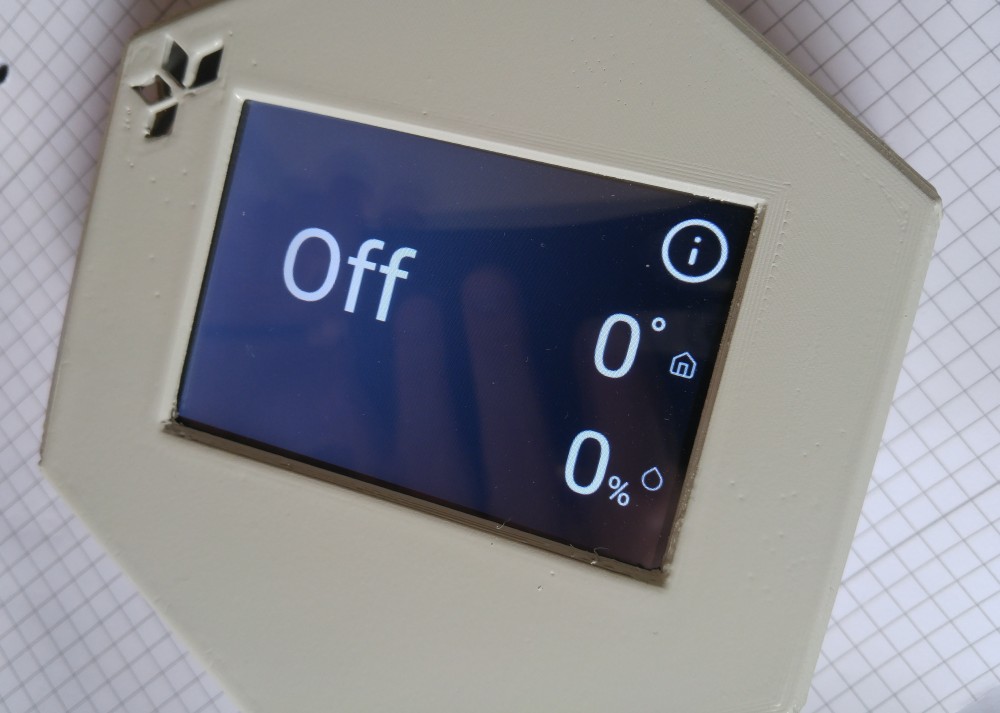
  • the screen after 30 min still looks like this:
  • the webinterface is responding, but
    • does also not show the temperature value (see screenshot from my previous post)
    • does not execute reboot command
    • does execute Github version checking
  • when SSH command “sudo shutdown” is executed it does not show the console on the screen, but the screen turns white when shutdown is complete
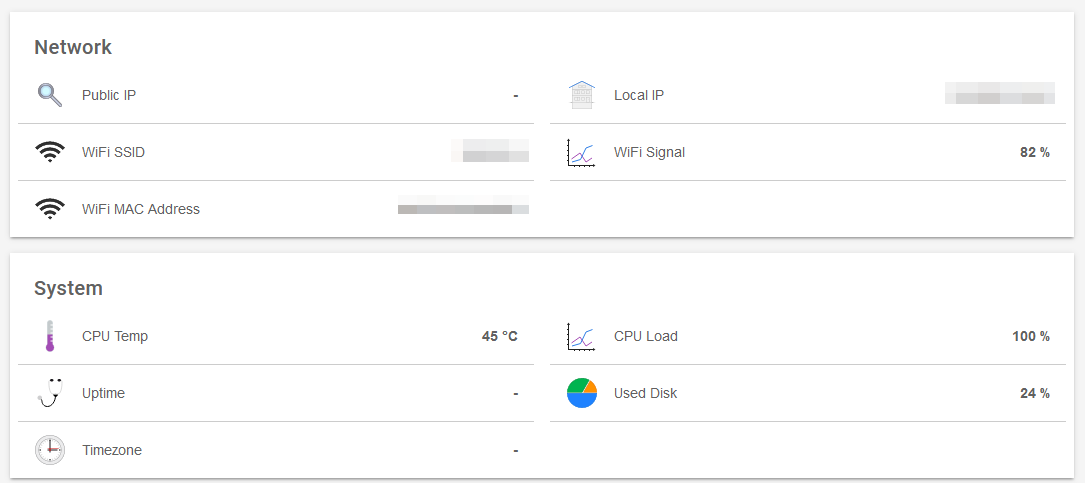
  • within 15 min after booting, the “info” screen in the webinterface looks like this:
    while the touchscreen shows this (as in my first post): the touch screen responds; by tapping on the circles “i” symbol all values (Public IP…) are only shown as “–”

What I tried:

Do you mean the problem remained with the same board with the new sensor? If yes please check polarity of connecting cable and try this on the sensor pins .

  • Yes, after changing the sensors, the problem remained. I checked the polarity: ok. I resoldered all solder joints on the back: done

Did you try this solution on this unit?

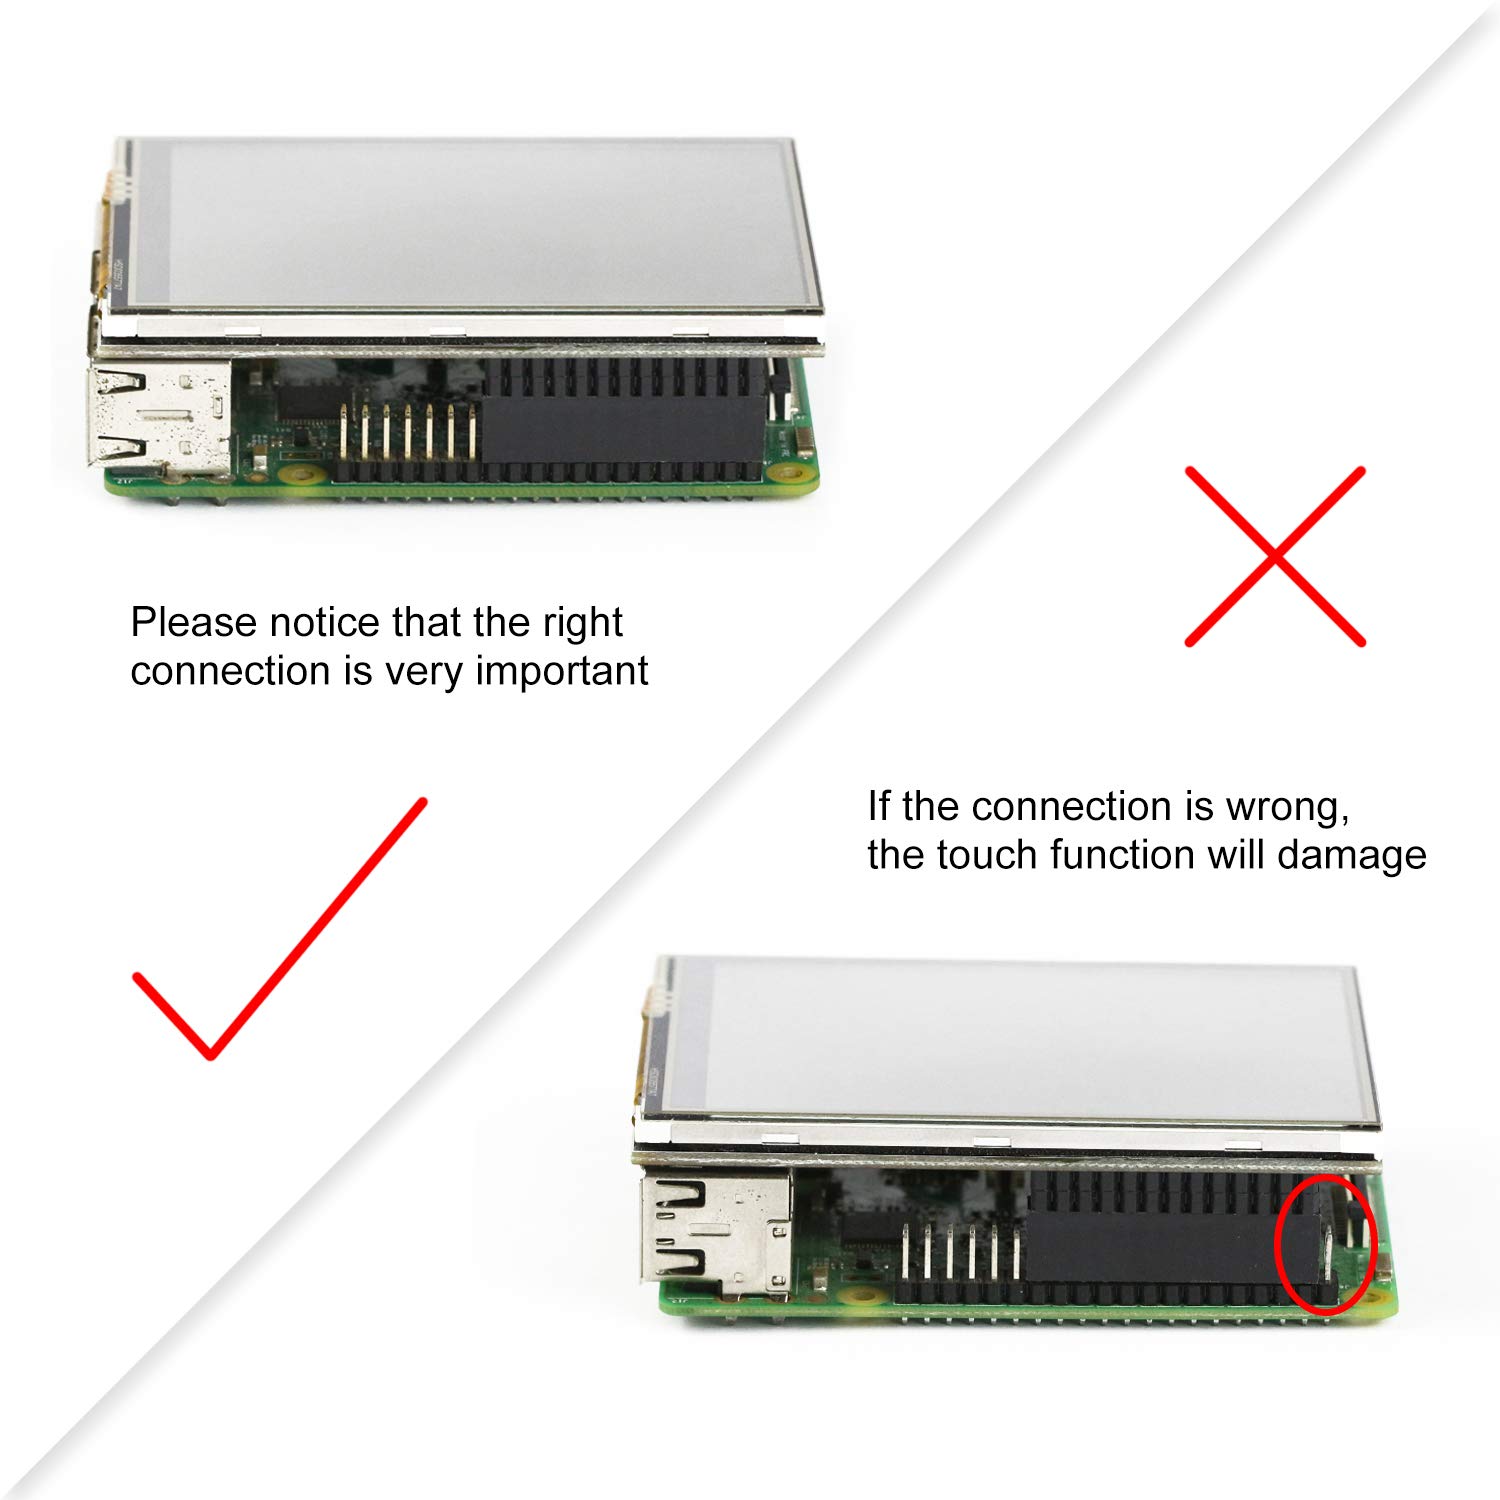
  • Yes, when connecting the touch panel directly to the Pi, the screen remained white and did not show the console. I sticked to this picture:
  • when connecting the touch panel (in powerless state) to the LCD-connector and rebooting, the console appears while booting and it repeats here:
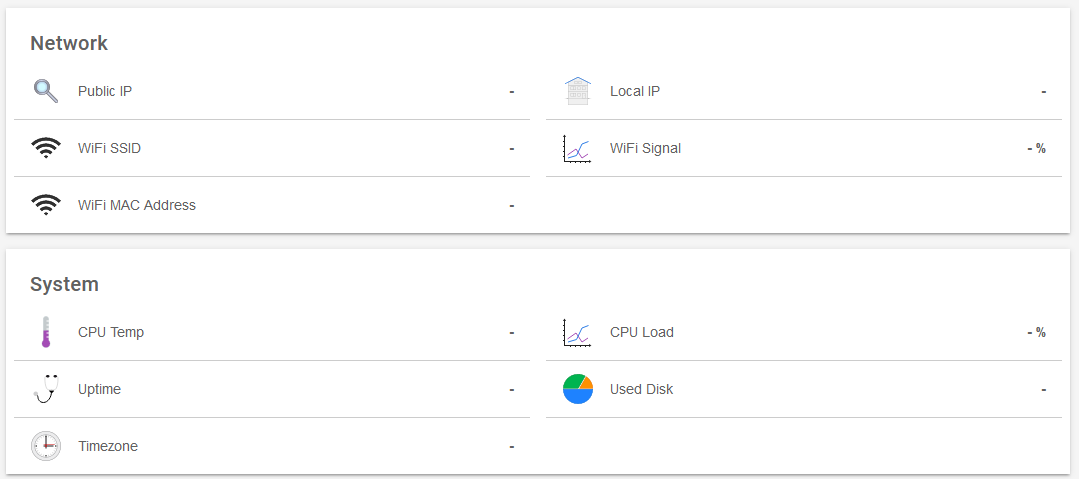
I am out of ideas with this unit so far. If you need any files or logs, let me know.

That is really weird… So let me open my black magic book:

  1. Run this over SSH
    python /home/pi/scripts/bme280.py
    and report here the output. It should simply report the sensor readings or an error.
    Background info:
    (If there is no value read from the sensor) the LCD initializes to 0 and stays like that until a different value arrives (sensor is checked periodically every x seconds).
  2. Run this over SSH 30 minutes after boot
    uptime
    and report here the output
    Background info:
    The CPU Load value is not refreshed very frequently so is not the ideal method to get an idea of what is happening during boot. Please ignore this field for the moment.
  3. Does touching the icons on the LCD (fire, waterdrop, shower) respond?
  4. Run this over SSH 30 minutes after boot
    openhab-cli showlogs
    then press the reboot button on the web interface and paste here (in code fences) only the lines of logs that were generated during the following 5 seconds.
  5. Remove completely the LCD, boot and check web interface after 30 minutes

My black magic book says that if all above tests don’t bring any new clues, it would be either a bad card (or bad flash?) or a bad power block.

Chip ID     : 96
Version     : 0
Temperature :  24.66 C
Pressure :  1014.34503974 hPa
Humidity :  29.4550953031 %
pi@raspberrypi:~ $ uptime
 17:45:41 up 16 min,  1 user,  load average: 1.33, 1.35, 1.07
pi@raspberrypi:~ $ uptime
 17:50:03 up 20 min,  1 user,  load average: 1.38, 1.45, 1.18
pi@raspberrypi:~ $ uptime
 17:54:24 up 25 min,  1 user,  load average: 0.20, 0.84, 1.00
pi@raspberrypi:~ $ uptime
 17:56:28 up 27 min,  1 user,  load average: 0.17, 0.61, 0.89
pi@raspberrypi:~ $ uptime
 17:59:05 up 29 min,  1 user,  load average: 0.12, 0.40, 0.77
pi@raspberrypi:~ $ uptime
 18:00:05 up 30 min,  1 user,  load average: 0.04, 0.32, 0.71

at one point of time, after the icons appeared, it worked once. After 30 mins uptime, the touch screen does not respond.

pi@raspberrypi:~ $ openhab-cli showlogs

==> /var/log/openhab2/audit.log <==

==> /var/log/openhab2/events.log <==
2020-03-21 18:01:52.187 [vent.ItemStateChangedEvent] - TempSetpoint changed from 19.5 to 18.5
2020-03-21 18:01:52.372 [ome.event.ItemCommandEvent] - Item 'HeatingPin' received command OFF
2020-03-21 18:01:52.438 [vent.ItemStateChangedEvent] - TempSetpoint changed from 18.5 to 19.5
2020-03-21 18:01:52.481 [nt.ItemStatePredictedEvent] - HeatingPin predicted to become OFF
2020-03-21 18:01:52.658 [ome.event.ItemCommandEvent] - Item 'HeatingPin' received command OFF
2020-03-21 18:01:52.721 [vent.ItemStateChangedEvent] - TempSetpointC changed from 19.5 to 18.5
2020-03-21 18:01:52.732 [vent.ItemStateChangedEvent] - TempSetpointC changed from 18.5 to 19.5
2020-03-21 18:01:52.868 [ome.event.ItemCommandEvent] - Item 'TempSetpoint' received command 19.5
2020-03-21 18:01:52.898 [nt.ItemStatePredictedEvent] - HeatingPin predicted to become OFF
2020-03-21 18:01:53.113 [ome.event.ItemCommandEvent] - Item 'TempSetpoint' received command 19.5

==> /var/log/openhab2/openhab.log <==
2020-03-21 18:02:15.086 [WARN ] [ng.exec.internal.handler.ExecHandler] - Tried to execute '/home/pi/scripts/getBMEhumi.sh', but it is not contained in whitelist.
2020-03-21 18:02:15.139 [WARN ] [ng.exec.internal.handler.ExecHandler] - Tried to execute '/home/pi/scripts/getBMEtemp.sh', but it is not contained in whitelist.
2020-03-21 18:02:25.093 [WARN ] [ng.exec.internal.handler.ExecHandler] - Tried to execute '/home/pi/scripts/getBMEhumi.sh', but it is not contained in whitelist.
2020-03-21 18:02:25.146 [WARN ] [ng.exec.internal.handler.ExecHandler] - Tried to execute '/home/pi/scripts/getBMEtemp.sh', but it is not contained in whitelist.
2020-03-21 18:02:35.100 [WARN ] [ng.exec.internal.handler.ExecHandler] - Tried to execute '/home/pi/scripts/getBMEhumi.sh', but it is not contained in whitelist.
2020-03-21 18:02:35.152 [WARN ] [ng.exec.internal.handler.ExecHandler] - Tried to execute '/home/pi/scripts/getBMEtemp.sh', but it is not contained in whitelist.
2020-03-21 18:02:45.121 [WARN ] [ng.exec.internal.handler.ExecHandler] - Tried to execute '/home/pi/scripts/getBMEhumi.sh', but it is not contained in whitelist.
2020-03-21 18:02:45.161 [WARN ] [ng.exec.internal.handler.ExecHandler] - Tried to execute '/home/pi/scripts/getBMEtemp.sh', but it is not contained in whitelist.
2020-03-21 18:02:55.138 [WARN ] [ng.exec.internal.handler.ExecHandler] - Tried to execute '/home/pi/scripts/getBMEhumi.sh', but it is not contained in whitelist.
2020-03-21 18:02:55.179 [WARN ] [ng.exec.internal.handler.ExecHandler] - Tried to execute '/home/pi/scripts/getBMEtemp.sh', but it is not contained in whitelist.
2020-03-21 18:03:05.146 [WARN ] [ng.exec.internal.handler.ExecHandler] - Tried to execute '/home/pi/scripts/getBMEhumi.sh', but it is not contained in whitelist.
2020-03-21 18:03:05.188 [WARN ] [ng.exec.internal.handler.ExecHandler] - Tried to execute '/home/pi/scripts/getBMEtemp.sh', but it is not contained in whitelist.
2020-03-21 18:03:15.154 [WARN ] [ng.exec.internal.handler.ExecHandler] - Tried to execute '/home/pi/scripts/getBMEhumi.sh', but it is not contained in whitelist.
2020-03-21 18:03:15.195 [WARN ] [ng.exec.internal.handler.ExecHandler] - Tried to execute '/home/pi/scripts/getBMEtemp.sh', but it is not contained in whitelist.
2020-03-21 18:03:25.170 [WARN ] [ng.exec.internal.handler.ExecHandler] - Tried to execute '/home/pi/scripts/getBMEhumi.sh', but it is not contained in whitelist.
2020-03-21 18:03:25.204 [WARN ] [ng.exec.internal.handler.ExecHandler] - Tried to execute '/home/pi/scripts/getBMEtemp.sh', but it is not contained in whitelist.
2020-03-21 18:03:35.178 [WARN ] [ng.exec.internal.handler.ExecHandler] - Tried to execute '/home/pi/scripts/getBMEhumi.sh', but it is not contained in whitelist.
2020-03-21 18:03:35.213 [WARN ] [ng.exec.internal.handler.ExecHandler] - Tried to execute '/home/pi/scripts/getBMEtemp.sh', but it is not contained in whitelist.
2020-03-21 18:03:45.186 [WARN ] [ng.exec.internal.handler.ExecHandler] - Tried to execute '/home/pi/scripts/getBMEhumi.sh', but it is not contained in whitelist.
2020-03-21 18:03:45.222 [WARN ] [ng.exec.internal.handler.ExecHandler] - Tried to execute '/home/pi/scripts/getBMEtemp.sh', but it is not contained in whitelist.

[Reboot button was pressed in the webinterface:]

==> /var/log/openhab2/events.log <==
2020-03-21 18:03:45.671 [ome.event.ItemCommandEvent] - Item 'RebootButton' received command ON

==> /var/log/openhab2/openhab.log <==
2020-03-21 18:03:45.704 [INFO ] [lipse.smarthome.model.script.Default] - RebootButton Selected

==> /var/log/openhab2/events.log <==
2020-03-21 18:03:45.719 [vent.ItemStateChangedEvent] - RebootButton changed from NULL to ON
2020-03-21 18:03:45.816 [vent.ItemStateChangedEvent] - RebootButton changed from ON to OFF
2020-03-21 18:03:45.997 [ome.event.ItemCommandEvent] - Item 'RebootCommand' received command ON
2020-03-21 18:03:46.030 [nt.ItemStatePredictedEvent] - RebootCommand predicted to become ON
2020-03-21 18:03:46.190 [vent.ItemStateChangedEvent] - RebootCommand changed from NULL to ON

==> /var/log/openhab2/openhab.log <==
2020-03-21 18:03:46.266 [WARN ] [ng.exec.internal.handler.ExecHandler] - Tried to execute '/home/pi/scripts/reboot.sh', but it is not contained in whitelist.

In the log I can see that pressing the touchscreen creates the appropriate command in the log, but it only works for the screen when the flame icon is already activated for the “+” and “-” symbols. Pressing on other symbols (flame, water drop, shower or “i”) does not create a response in the log.

When shutting down from this state via SSH, the screen shows the same flame, water drop, shower , 18 °C and + and - signs, but the console is not shown. after some minutes, the screen turns white ( I think the shutdown is complete then).

pi@raspberrypi:~ $ uptime
 18:16:38 up 3 min,  1 user,  load average: 3.46, 1.84, 0.76
pi@raspberrypi:~ $ uptime
 18:21:22 up 8 min,  1 user,  load average: 0.50, 1.53, 0.96
pi@raspberrypi:~ $ uptime
 18:29:55 up 16 min,  1 user,  load average: 1.22, 1.31, 1.10
pi@raspberrypi:~ $ uptime
 18:35:34 up 22 min,  1 user,  load average: 1.25, 1.42, 1.22
pi@raspberrypi:~ $ uptime
 18:42:17 up 29 min,  1 user,  load average: 0.22, 0.49, 0.83

The webinterface looks the same to me with or without the LCD attached.

It seems many functions are not executed because they are not contained in the whitelist. I have no clue how to add scripts to the whitelist. If you propose to flash a new image to the SD-card, I’ll give it a try.

It seems you have upgraded after you used the HestiaPi image.
The whitelist issue is something that appeared in 2.5 and therefore it is not merged in the official release.
Please use this workaround or simply don’t upgrade yet.
Everything you reported should go with this… btw the CPU load was indeed fine. It is just the UI that confuses during startup (maybe we should delay the first check of CPU load)

Hello again and thank you for you quick help again!

Yes, you are right, I did upgrade after the last-reflash, because I experienced problems.

Thank you for your hint to the workaround. I thought I’ll re-flash the SD-card instead of giving a try to the workaround. I re-flashed the SD-card and did not perform “sudo apt-get update” and “sudo apt-get upgrade” this time. Here is the SSH log after the fresh install:

pi@raspberrypi:~ $ uptime
 09:50:50 up 25 min,  1 user,  load average: 0.19, 0.12, 0.19
pi@raspberrypi:~ $ uptime
 10:04:11 up 39 min,  1 user,  load average: 0.03, 0.08, 0.10
pi@raspberrypi:~ $ python /home/pi/scripts/bme280.py
Chip ID     : 96
Version     : 0
Temperature :  26.27 C
Pressure :  1018.48516063 hPa
Humidity :  29.0394910303 %
pi@raspberrypi:~ $ uptime
 10:09:07 up 44 min,  1 user,  load average: 0.12, 0.10, 0.10
pi@raspberrypi:~ $ uptime
 10:24:22 up 59 min,  1 user,  load average: 0.17, 0.11, 0.09
pi@raspberrypi:~ $ openhab-cli showlogs

==> /var/log/openhab2/audit.log <==

==> /var/log/openhab2/events.log <==

==> /var/log/openhab2/openhab.log <==
    -> Export-Package: org.eclipse.smarthome.core.events; bundle-symbolic-name="                                                                                                                                                                           org.eclipse.smarthome.core"; bundle-version="0.10.0.oh240"; version="0.0.0"; use                                                                                                                                                                           s:="org.eclipse.smarthome.core.items,org.osgi.service.event,org.eclipse.smarthom                                                                                                                                                                           e.core.types"

        at org.eclipse.osgi.container.Module.start(Module.java:444) ~[?:?]
        at org.eclipse.osgi.container.ModuleContainer$ContainerStartLevel.incSta                                                                                                                                                                           rtLevel(ModuleContainer.java:1634) ~[?:?]
        at org.eclipse.osgi.container.ModuleContainer$ContainerStartLevel.incSta                                                                                                                                                                           rtLevel(ModuleContainer.java:1613) ~[?:?]
        at org.eclipse.osgi.container.ModuleContainer$ContainerStartLevel.doCont                                                                                                                                                                           ainerStartLevel(ModuleContainer.java:1585) ~[?:?]
        at org.eclipse.osgi.container.ModuleContainer$ContainerStartLevel.dispat                                                                                                                                                                           chEvent(ModuleContainer.java:1528) ~[?:?]
        at org.eclipse.osgi.container.ModuleContainer$ContainerStartLevel.dispat                                                                                                                                                                           chEvent(ModuleContainer.java:1) ~[?:?]
        at org.eclipse.osgi.framework.eventmgr.EventManager.dispatchEvent(EventM                                                                                                                                                                           anager.java:230) [?:?]
        at org.eclipse.osgi.framework.eventmgr.EventManager$EventThread.run(Even                                                                                                                                                                           tManager.java:340) [?:?]

All the time since I started the SSH session above, the LCD shows the screen from my first post. The web-interface does not work. The LCD reacts to the “i” button. In the Info-screen, all values are shown as “–”

I’ll leave this fresh install running for a while. I you have any clues what I could try, let me know.

You got all the issues together :frowning:
Try this over SSH and I believe this would be the last issue to tackle:

sudo systemctl stop openhab2
sudo openhab-cli clean-cache
sudo openhab-cli reset-ownership
sudo reboot

Thank you again for your quick help!

I inserted your commands. The webinterface worked after 30 min. Here is the SSH output:

pi@raspberrypi:~ $ uptime
 15:22:27 up 15 min,  1 user,  load average: 2.13, 1.75, 1.29
pi@raspberrypi:~ $ uptime
 15:35:49 up 28 min,  1 user,  load average: 1.91, 1.68, 1.47
pi@raspberrypi:~ $ python /home/pi/scripts/bme280.py
Traceback (most recent call last):
  File "/home/pi/scripts/bme280.py", line 173, in <module>
    main()
  File "/home/pi/scripts/bme280.py", line 161, in main
    (chip_id, chip_version) = readBME280ID()
  File "/home/pi/scripts/bme280.py", line 56, in readBME280ID
    (chip_id, chip_version) = bus.read_i2c_block_data(addr, REG_ID, 2)
IOError: [Errno 121] Remote I/O error
pi@raspberrypi:~ $ uptime
 16:41:55 up 34 min,  1 user,  load average: 1.55, 1.63, 1.49
pi@raspberrypi:~ $ python /home/pi/scripts/bme280.py
Traceback (most recent call last):
  File "/home/pi/scripts/bme280.py", line 173, in <module>
    main()
  File "/home/pi/scripts/bme280.py", line 161, in main
    (chip_id, chip_version) = readBME280ID()
  File "/home/pi/scripts/bme280.py", line 56, in readBME280ID
    (chip_id, chip_version) = bus.read_i2c_block_data(addr, REG_ID, 2)
IOError: [Errno 121] Remote I/O error
pi@raspberrypi:~ $ uptime
 16:55:55 up 48 min,  1 user,  load average: 0.16, 0.36, 0.76
pi@raspberrypi:~ $ python /home/pi/scripts/bme280.py
Traceback (most recent call last):
  File "/home/pi/scripts/bme280.py", line 173, in <module>
    main()
  File "/home/pi/scripts/bme280.py", line 161, in main
    (chip_id, chip_version) = readBME280ID()
  File "/home/pi/scripts/bme280.py", line 56, in readBME280ID
    (chip_id, chip_version) = bus.read_i2c_block_data(addr, REG_ID, 2)
IOError: [Errno 121] Remote I/O error

The sensor data is shown as zero, but the touch screen now completely responds. I am not sure if I am using the touch screen too fast. If I increase or decrease the temperature by repeatedly pushing the “+” or “-” signs too quickly, the setpoint temperature takes some time, until it is steady again:
I have uploaded a quick video showing the effect here (it will be available online for 7 days): Video

It is interesting, that the dicrect readout of the BME 280 now fails, although it worked before. Any suggestions what we can try next?

Does this return the sensor readings ok as before?
python /home/pi/scripts/bme280.py

Make sure the sensor wire is pushed all the way in with the correct polarity.

Good hint, although I thought I did not touch any sensor wires, I measured them with the oscilloscope. 3.3V, GND, SDL and SCK were ok on the plug, but not on the sensor board. I assumed, that the connector contac was not good. This was correct. After moving the sensor connector, several times, the display showed temperature and humidity values.

Strangely, after touching the screen, after each touch, some elements disappeared, until it was completely black at the end (not shown):

I rebooted it again.
15 min after boot, the display showed the screen from my first post. The webinterface looks like this:

19 min after boot, the temperature and humidity value is displayed.

20 min after boot, the flame, water drop and shower symbol is shown.

22 min after boot, I pressed on the flame symbol. The setpoint temperature was set to 70 °, which I could adjust to 23.5°. After reaching 23.5°, the touch screen stopped responding. I could set a new setpoint via webinterface, which was now fully available. Here is the SSH history

pi@raspberrypi:~ $ uptime
 18:42:35 up 8 min,  1 user,  load average: 1.49, 1.55, 0.95
pi@raspberrypi:~ $ uptime
 18:49:33 up 15 min,  1 user,  load average: 1.51, 1.42, 1.11
pi@raspberrypi:~ $ python /home/pi/scripts/bme280.py
Chip ID     : 96
Version     : 0
Temperature :  26.1 C
Pressure :  1018.64328579 hPa
Humidity :  30.4451281832 %
pi@raspberrypi:~ $ uptime
 18:53:15 up 19 min,  1 user,  load average: 2.56, 1.66, 1.26
pi@raspberrypi:~ $ uptime
 18:53:52 up 20 min,  1 user,  load average: 4.70, 2.38, 1.52
pi@raspberrypi:~ $ uptime
 18:54:45 up 20 min,  1 user,  load average: 2.77, 2.21, 1.51
pi@raspberrypi:~ $ uptime
 18:56:01 up 22 min,  1 user,  load average: 2.93, 2.35, 1.61

So now the webinterface and the sensor works, but not the touchscreen.

So I used the command
openhab-cli showlogs
to have a look, what is going on.

pi@raspberrypi:~ $ openhab-cli showlogs

==> /var/log/openhab2/audit.log <==

==> /var/log/openhab2/events.log <==
2020-03-22 19:04:17.925 [nt.ItemStatePredictedEvent] - MyTempProxy predicted to become 26.1
2020-03-22 19:04:17.945 [ome.event.ItemCommandEvent] - Item 'MyHumiProxy' received command 31.0
2020-03-22 19:04:18.055 [nt.ItemStatePredictedEvent] - MyHumiProxy predicted to become 31.0
2020-03-22 19:04:18.152 [vent.ItemStateChangedEvent] - MyHumiProxy changed from 31.1 to 31.0
2020-03-22 19:04:28.146 [vent.ItemStateChangedEvent] - MyHumi changed from 31.0 to 30.9
2020-03-22 19:04:28.301 [ome.event.ItemCommandEvent] - Item 'MyTempProxy' received command 26.1
2020-03-22 19:04:28.347 [nt.ItemStatePredictedEvent] - MyTempProxy predicted to become 26.1
2020-03-22 19:04:28.370 [ome.event.ItemCommandEvent] - Item 'MyHumiProxy' received command 30.9
2020-03-22 19:04:28.448 [nt.ItemStatePredictedEvent] - MyHumiProxy predicted to become 30.9
2020-03-22 19:04:28.518 [vent.ItemStateChangedEvent] - MyHumiProxy changed from 31.0 to 30.9

==> /var/log/openhab2/openhab.log <==
java.lang.NullPointerException: null
        at org.eclipse.smarthome.model.rule.runtime.internal.engine.RuleContextHelper.getContext(RuleContextHelper.java:68) ~[?:?]
        at org.eclipse.smarthome.model.rule.runtime.internal.engine.RuleEngineImpl.lambda$2(RuleEngineImpl.java:339) ~[?:?]
        at java.util.concurrent.Executors$RunnableAdapter.call(Executors.java:511) ~[?:?]
        at java.util.concurrent.FutureTask.run(FutureTask.java:266) ~[?:?]
        at java.util.concurrent.ScheduledThreadPoolExecutor$ScheduledFutureTask.access$201(ScheduledThreadPoolExecutor.java:180) ~[?:?]
        at java.util.concurrent.ScheduledThreadPoolExecutor$ScheduledFutureTask.run(ScheduledThreadPoolExecutor.java:293) ~[?:?]
        at java.util.concurrent.ThreadPoolExecutor.runWorker(ThreadPoolExecutor.java:1149) [?:?]
        at java.util.concurrent.ThreadPoolExecutor$Worker.run(ThreadPoolExecutor.java:624) [?:?]
        at java.lang.Thread.run(Thread.java:748) [?:?]

==> /var/log/openhab2/events.log <==
2020-03-22 19:04:38.510 [vent.ItemStateChangedEvent] - MyHumi changed from 30.9 to 31.3
2020-03-22 19:04:38.681 [ome.event.ItemCommandEvent] - Item 'MyTempProxy' received command 26.1
2020-03-22 19:04:38.723 [ome.event.ItemCommandEvent] - Item 'MyHumiProxy' received command 31.3
2020-03-22 19:04:38.775 [nt.ItemStatePredictedEvent] - MyTempProxy predicted to become 26.1
2020-03-22 19:04:38.870 [nt.ItemStatePredictedEvent] - MyHumiProxy predicted to become 31.3
2020-03-22 19:04:39.075 [vent.ItemStateChangedEvent] - MyHumiProxy changed from 30.9 to 31.3
2020-03-22 19:04:48.884 [vent.ItemStateChangedEvent] - MyHumi changed from 31.3 to 30.9
2020-03-22 19:04:49.024 [ome.event.ItemCommandEvent] - Item 'MyTempProxy' received command 26.1
2020-03-22 19:04:49.064 [ome.event.ItemCommandEvent] - Item 'MyHumiProxy' received command 30.9
2020-03-22 19:04:49.112 [nt.ItemStatePredictedEvent] - MyTempProxy predicted to become 26.1
2020-03-22 19:04:49.197 [nt.ItemStatePredictedEvent] - MyHumiProxy predicted to become 30.9
2020-03-22 19:04:49.347 [vent.ItemStateChangedEvent] - MyHumiProxy changed from 31.3 to 30.9

When I am tapping on the touch screen no entry in the log is shown. The screen is constantly updated with new sensor values.
Do you have another idea, what we could try?

When you reboot, leave it alone for 30 minutes (an update exists that drops this to 15 minutes but the whitelist issue needs to be resolved until we release it).
Touching the LCD should not produce anything in the OH logs. Assemble everything carefully and try once more.

I’ll be submitting an update soon that drops this to 10 (from white screen to fully functioning, not just a restart of OH). I can drop it even further if we explore the delaying the check for CPU load before switching over you mentioned above (I’ll bring up the details on github when I submit the initial PR). I’m really close but I want to document the Rules a bit more to help you review the changes and there is one annoying thing I’m trying to change (in US mode, if Heating or Cooling are to turn on the device and the FanMode is ON after a reboot, I want the Heating/Cooling interface to be shown by default after the reboot and right now the Fan screen is showing). There is a timing issue here I think that I need to sort out.

Note: OH 2.5.3 which was released last week fixes the Exec binding whitelist binding bugs. No more need for the workaround.

Anyway, expect a PR this week.

@gon, if you want to be a tester I can provide the changes in a Google Drive and you can try it out. I don’t have a set of upgrade procedures written yet though.

Dear HestiaPi, dear rlkoshak, thank you for your help.

I did not respond yet, because my results stayed the same after several tries.

Sure, I can try your changes, but don’t expect too much from me (I am not good at linux). A flashable SD card image would be perfect

During the quarantine period we will not be able to upload large files like flashable images, so you will wait a little longer for that.

Is the screen white and blank during this 10-30 minute boot time?

No. You should be seeing the boot sequence at the beginning and then the screen with some symbols and a couple of 0.
If yours is blank check the screen is inserted correctly. Be careful even a one pin mistake can kill the LCD