From the old Hestia website:
Allow logging for temperature values and plot them in charts of variable period of time ideally along heating status changes.
From the old Hestia website:
Allow logging for temperature values and plot them in charts of variable period of time ideally along heating status changes.
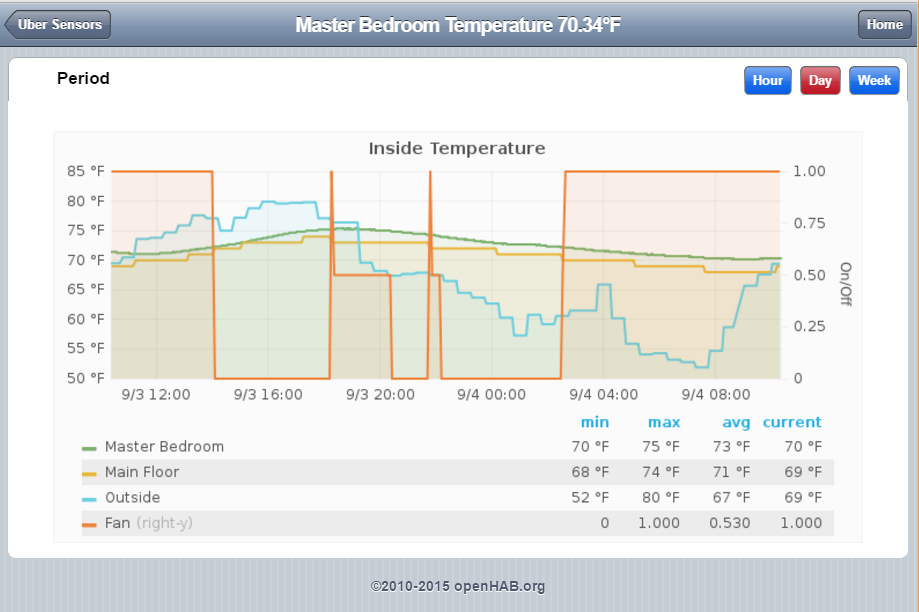
Only a matter of configuration/sitemaps… Anyone to write a simple guide for that? Checkout an easy example:
OpenHab persistance is definitely on my todo list, but fairly low down, so if anyone beats me to it…